Solar System monitoring - Solar Analytics Review

Update Summary - Sept 2022
Since this review was first published two years ago, Solar Analytics has made some significant improvements and added additional features to help users better monitor solar and energy storage systems. The three main updates include:
Inverter integration - can now use inverter data and does not require any additional hardware
Bill plan comparison - helps users identify the best electricity plan based on their typical energy usage to reduce bills
New pricing structure - New pay-by-the-month options.
As the saying goes, information is power. Installing solar is an excellent way to reduce energy costs and emissions, but the savings can be dramatically increased with the added knowledge gained through monitoring. In this article, we explain why monitoring is a crucial part of a solar installation and the importance of monitoring electricity consumption as well as solar generation. Solar Analytics is one of the leading solar monitoring devices. We examine the unique information it provides, how it can be used for early detection of faults, and weigh it up against some common inverter-based monitoring platforms.
Article contents:
Is your solar system performing well?
Installing a solar system on your home or business is a relatively large investment, so it’s important to know whether the system is functioning correctly and generating the level of power expected throughout the year. Understanding whether a system is operating as intended is not easy for most people who aren’t experienced in monitoring solar systems. For example, there are many factors that can influence the performance of a system, including:
Local weather & various atmospheric losses
Power temperature de-rating
Partial or full shading
Cable and inverter losses
Panel tilt and orientation
Time of year - Seasonal shifts
Taking all these factors into account is virtually impossible for the average person lacking technical knowledge and the specialised equipment required; this is where accurate real-time system monitoring is crucial.
When a solar system is first installed, the owner is often happy to watch the daily power generation and keep a close eye on the display or app to ensure it’s operating as expected. While it’s exciting to watch your own power station working, it’s not something people can dedicate time every day or week to monitor closely. Over time, the system may not be checked for months or even years, and it’s often not until a significant fault or problem happens that the owner takes a closer look.
Difficulties Monitoring Solar
System performance can vary dramatically throughout the year due to the seasonal climate shifts, changing weather conditions and shading issues. This is much more noticeable in the southern Australian states, where the sun-path changes dramatically throughout the year, and the average summer daily generation can be more than double the daily winter generation.

Over time, solar panels slowly degrade and reduce power output by 0.4% to 0.7% per year, depending on the type of cells. Another significant factor is reduced performance due to dirt build-up, mould growth or debris like leaves and bird droppings. If the panels are not cleaned periodically, the obstructions can lead to the formation of hot-spots and even result in panel failure in extreme situations.
There are several third-party monitoring platforms available today, but in this article, we review Solar Analytics which is the most popular system in Australia, with over 40,000 systems installed around the country.
The Solar Analytics System
There are now two Solar Analytics options:
The classic option - requires a monitoring device to be installed
The integrated option - if you have a compatible solar inverter

Classic Option
The classic option uses the Solar Analytics add-on monitoring device that lets you closely monitor both solar generation and electricity consumption in real time. The system uses a small electronic module installed inside the switchboard and highly accurate sensors (CT clamps) to measure solar power generation and electricity consumption. The data is sent to a mobile App every few seconds via the onboard 4G transmitter and analysed by the smart algorithms developed by the solar analytics team to provide an abundance of useful information such as:
Provides overall solar system performance
Your electricity usage and consumption patterns in 5-second intervals
Net electricity bought and sold
How much electricity should your system be generating vs actual generation
Estimated savings and credits
Monitor individual sub-circuits such as hot water or heating
Grid voltage and frequency monitoring
Alerts and faults diagnostics
Integrated Option
The new integrated option allows the solar analytics system to directly access the solar inverter data rather than using the add-on solar analytics meter. This has several benefits, especially if the system includes battery storage, as the classic system is unable to monitor battery systems. However, the integrated option only works with a select number of solar inverter brands, including Fronius, Sungrow and Goodwe. Additionally, the existing system must also have the consumption meter installed which is typically done during the solar inverter installation. The information and features provided are listed below:
Overall solar system performance
Your electricity usage and consumption patterns shown in 5-minute intervals
Net electricity bought and sold
How much electricity should your system be generating vs actual generation
Battery system monitoring
Estimated savings and credits
Grid voltage and frequency monitoring
Alerts and faults diagnostics
Solar Analytics monitoring platform
By closely analysing the consumption and solar generation data, the patented solar analytics algorithms can accurately detect and diagnose faults, as well as identify under-performance due to the numerous reasons explained in greater detail below.
The Solar Analytics system is also unique in the way it uses satellite and BOM data to report on system performance relative to the actual irradiation levels at your site. They also compare solar generation to other nearby systems in the area to help verify or identify any performance issues. This way if all the systems in an area are behaving similarly due to atmospheric interference like smog and smoke, this can be accounted for and not raise unnecessary alarms or warnings.
Grid issues: The system can also measure grid voltage and frequency on 1,2, or 3-phase systems using a ‘Class A’ meter which logs data with an accuracy of +/-0.5%. This is especially useful for diagnosing grid-related issues such as high grid voltage, which is a common reason for under-performance in many areas due to causing inverters to shutdown or de-rate power output.
Solar Analytics Vs inverter monitoring
Most solar inverters come with built-in Wifi and app-based monitoring platforms which let you monitor the solar generation and can notify you of any system faults. Many of these systems can also provide consumption monitoring with the installation of an additional ‘energy meter’ which is connected to the solar inverter. Like the solar Analytics module, the additional energy meter must be installed in the main switchboard, but it also needs to be hard-wired to the solar inverter. This can be problematic if the inverter is located a long way from the switchboard as data communication over a long distance can become corrupted and drop out due to interference. Physically running the cable can also become difficult or impossible, especially if the roof or underfloor access is unavailable. The solar analytics system doesn’t require a connection to the solar inverter so it can be much easier to install or be retrofitted to any household or business with an existing solar system.
Solar inverter monitoring platform - Image credit Huawei
The Sungrow inverter monitoring platform
The biggest issue with solar inverter monitoring is that it's dependent on the stability of the local Wifi network. Solar inverter monitoring requires a wifi connection to transmit data to the cloud. However, if the signal is unstable or drops out, the connection is lost along with the monitoring. This, of course, can be avoided if the inverter is hard-wired to the modem with a dedicated communications cable. Another issue relying on wifi is, if the modem is replaced or reset, then often the inverter may need to to be reconfigured by a technician to re-establish communications.
Advantages of Solar Analytics monitoring
Simple, easy to use and understand
Consumption monitoring of individual power circuits
Alerts owner of any performance issues
Uses satellite and BOM data to analyse system performance
Not reliant on local Wifi - Built-in 4G communications
Provides an accurate estimate of electricity costs/credits
Advantages of solar inverter monitoring
Dedicated platform designed for specific solar inverters
Provides battery information and state of charge (SOC)
Can provide individual string (solar) voltage/current data
Alerts of any earth faults
Lower cost - many inverters now include a basic energy meter
One area where the Solar Analytics system really shines in reliable communications due to having an onboard sim card and 4G connection. If there is mobile reception in the area, then the solar analytics system will not drop out.
The Importance Of Consumption Monitoring
Electricity consumption patterns can vary wildly between different households and most owners are completely unaware of how much electricity is being consumed at any point in time, or which appliances are consuming the most power. For example, most people do not realise that heating (of any kind) can be responsible for up to 80% of all energy consumption during the winter months. Electric hot water systems alone can be responsible for as much as 40% of total electricity consumption. This is one area where the solar analytics system really shines by providing detailed consumption data, plus the ability to monitor individual power circuits like hot water or heating systems.
The more you understand about your consumption patterns the more electricity you can save. For example, many people use small compact electric fan or oil heaters thinking they are energy-saving appliances, when in fact they are extremely inefficient compared to a modern reverse cycle split system. Both appliances draw the same amount of electricity - approx 1500 watts continuously, but the split system provides 4 to 5 times the heat energy compared to a little fan heater. Using a consumption monitor or energy meter, the owner can clearly see the consumption levels when different appliances are turned on and off.
Early detection of Faults
Detecting a fault early is the best way to reduce the risk of system failure and potential equipment or property damage. Solar systems are generally very reliable, but over time extreme weather conditions can result in problems like water ingress and accelerated panel degradation. A good example of this is due to the overly stringent regulations in Australia all rooftop solar installations are required to have a rooftop isolator installed. This is basically a plastic box with a special DC isolation switch inside. Being located on the rooftop under extreme weather conditions for many years can result in deterioration, water ingress or overheating which can cause a catastrophic failure. (Not surprisingly, this is currently one of the leading causes of system failure in Australia). However, this type of serious fault can often be prevented early on, before things get bad, by detecting and alerting the owner about a reduction in system performance due to possible short circuits or arcing inside the isolator.
Problems with solar - Failure modes
Panel earth leakage – PID
Rooftop isolator faults - Water ingress
Cell hot spots and micro-cracking
Inverter overheating
High grid voltage causing inverter shutdown
Earth leakage is a common problem with older solar panels which can be caused by a number of factors, the most common being what is known as PID or potential induced degradation. Most grid-connected solar panels are linked together in strings that operate at high voltages from 300V to 600V. Panels operating at these elevated voltages over many years can in some cases develop a current leak or earth leak through the cells to the aluminium frames of the solar panels, which are grounded via an earth cable for safety.
Maintenance Alerts
Solar systems have no moving parts and are generally very low maintenance. However, over time many factors can reduce performance and dramatically decrease power output including; dirt built up and mould growth, shading from trees (which can grow surprisingly fast in spring), and inverters overheating. Without addressing these issues, over a few months generation can be reduced dramatically, and in turn, electricity savings can plummet, meaning bills go up.

During the first few weeks after installation, the solar analytics system will ‘learn’ the power generation profile of your system and will take into account drops in output due to shading from trees or rooftop obstacles like chimneys. Solar Analytics system will also be able to compare the power output to other systems in the area to determine if there is a problem which might need to be addressed. Also if your solar output changes dramatically during the day, and other systems in the area don’t have a similar problem, then you may be alerted of a possible issue with your system.
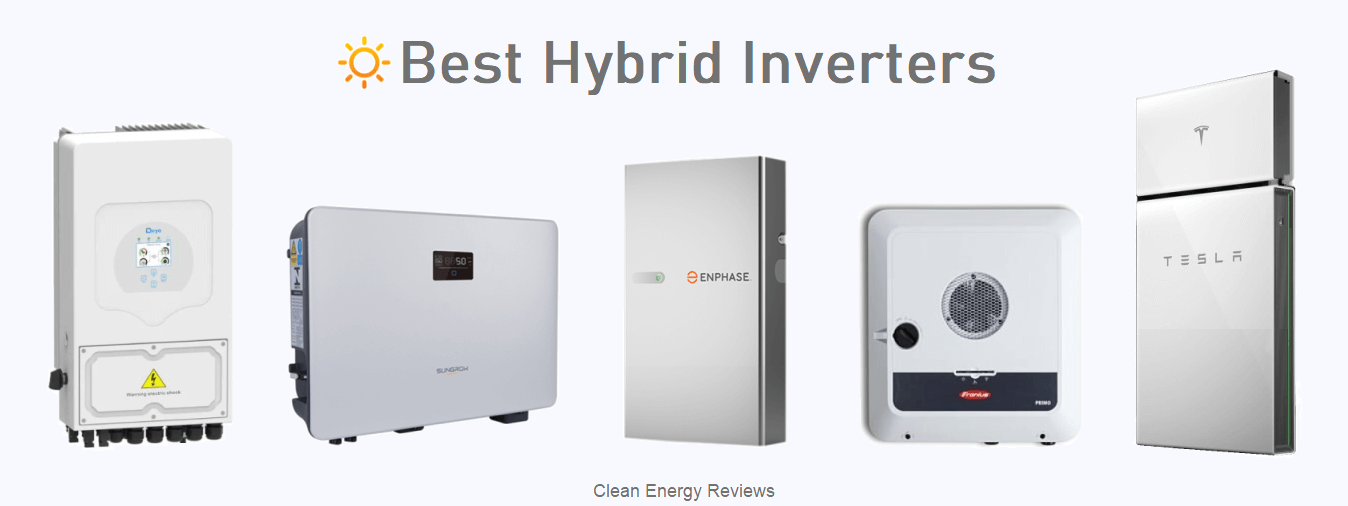
The downside – No DC battery monitoring
The solar Analytics system can monitor AC-coupled batteries such as the popular Tesla Powerwall 2, Sonnen ECO, Senec, and numerous other AC-coupled battery systems. However, most modern home battery systems use hybrid inverters which are DC-coupled. Since the Solar Analytics system can only monitor AC energy flow from the inverter and AC energy to/from the grid, it is blind to the DC energy going into the battery. Without this data, the system cannot measure exactly how much solar was generated and whether the system is performing as expected.
Fortunately, the integrated option will provide battery data to the solar analytics system for those using one of the compatible hybrid inverters, either a Goodwe, Sungrow or Fronius.
Based on the consumption and generation data, solar analytics can determine the optimum battery size to suit your energy profile - no point having a huge battery if you don’t have enough excess solar to charge it!
How much?
The Solar Analytics unit itself is not overly expensive at around $350 for the base unit and a little more for the 3-phase unit. However, since the module and CT sensors must be mounted inside the main electrical switchboard, installation must be done by a qualified electrician which will add several hundred to the cost, depending on the complexity of the installation. The integrated option is cheaper since it does not include any hardware costs or data plans.


Once installed, the system can be activated by the installer and a subscription option must be chosen. Since the unit requires mobile data to operate a small fee is required as is the case with any mobile device. There are monthly, yearly, and lifetime subscription options with the $250 lifetime option being the best value for money.
Detailed guide to the many specifications to consider when designing an off-grid solar system or complete hybrid energy storage system. Plus, a guide to the best grid-interactive and off-grid inverters and hybrid solar inverters for residential and commercial energy storage.